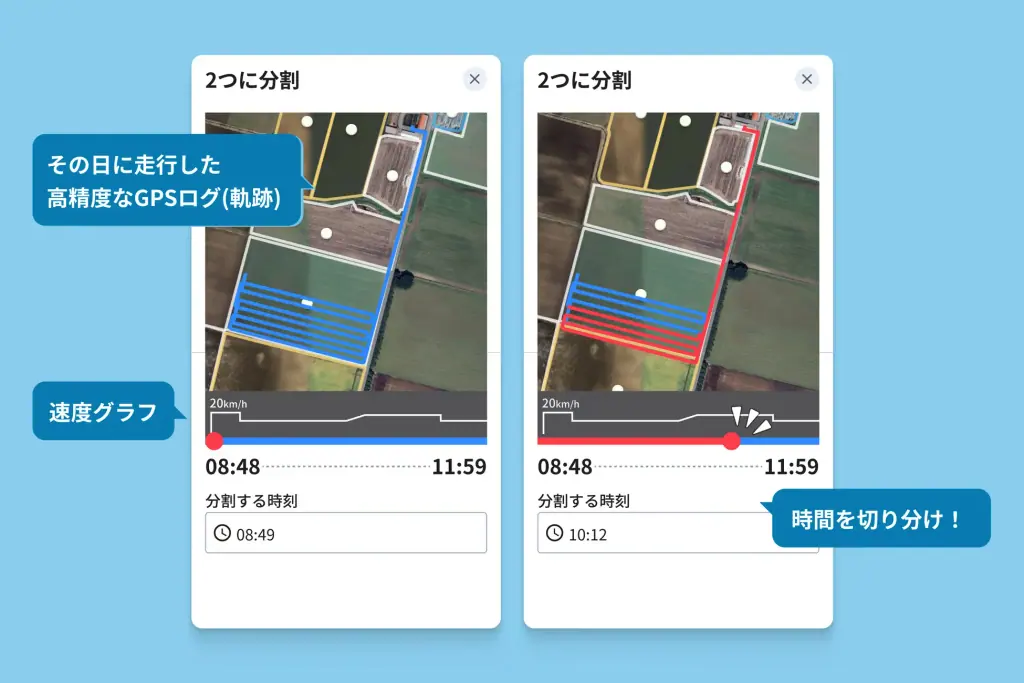
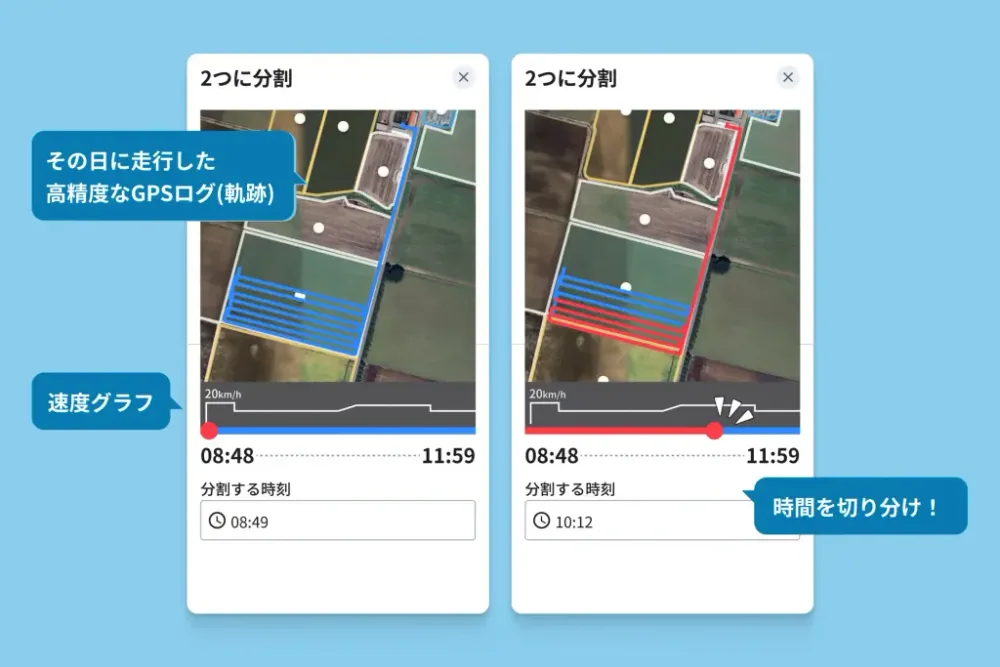
One trip can contain multiple tasks
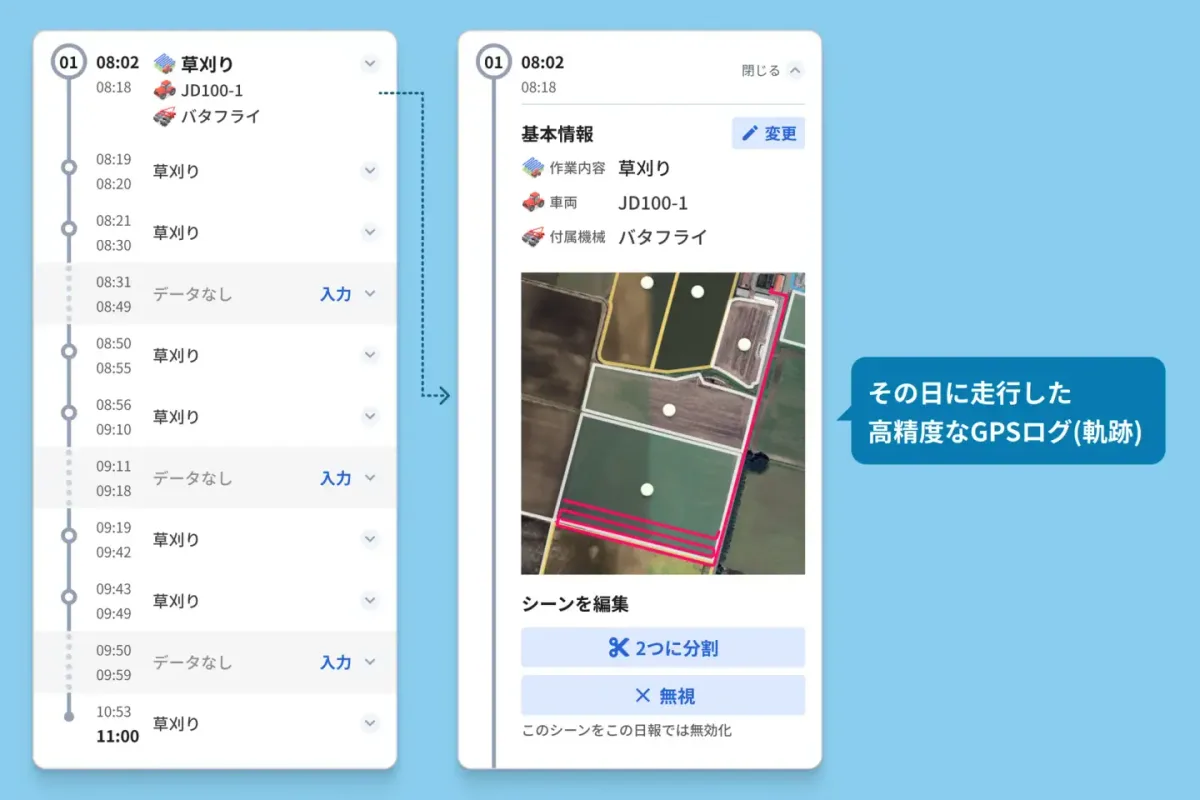
Users can inspect location, speed, and time, then split one GPS log into multiple tasks.
As the first product designer at a seed-stage startup, I organized nearly 300 customer requests alongside ideas from leadership, engineering, sales, and support, then shaped them into a one-year development roadmap.
For daily reporting, one of the prioritized themes, I defined the MVP and its development phases.
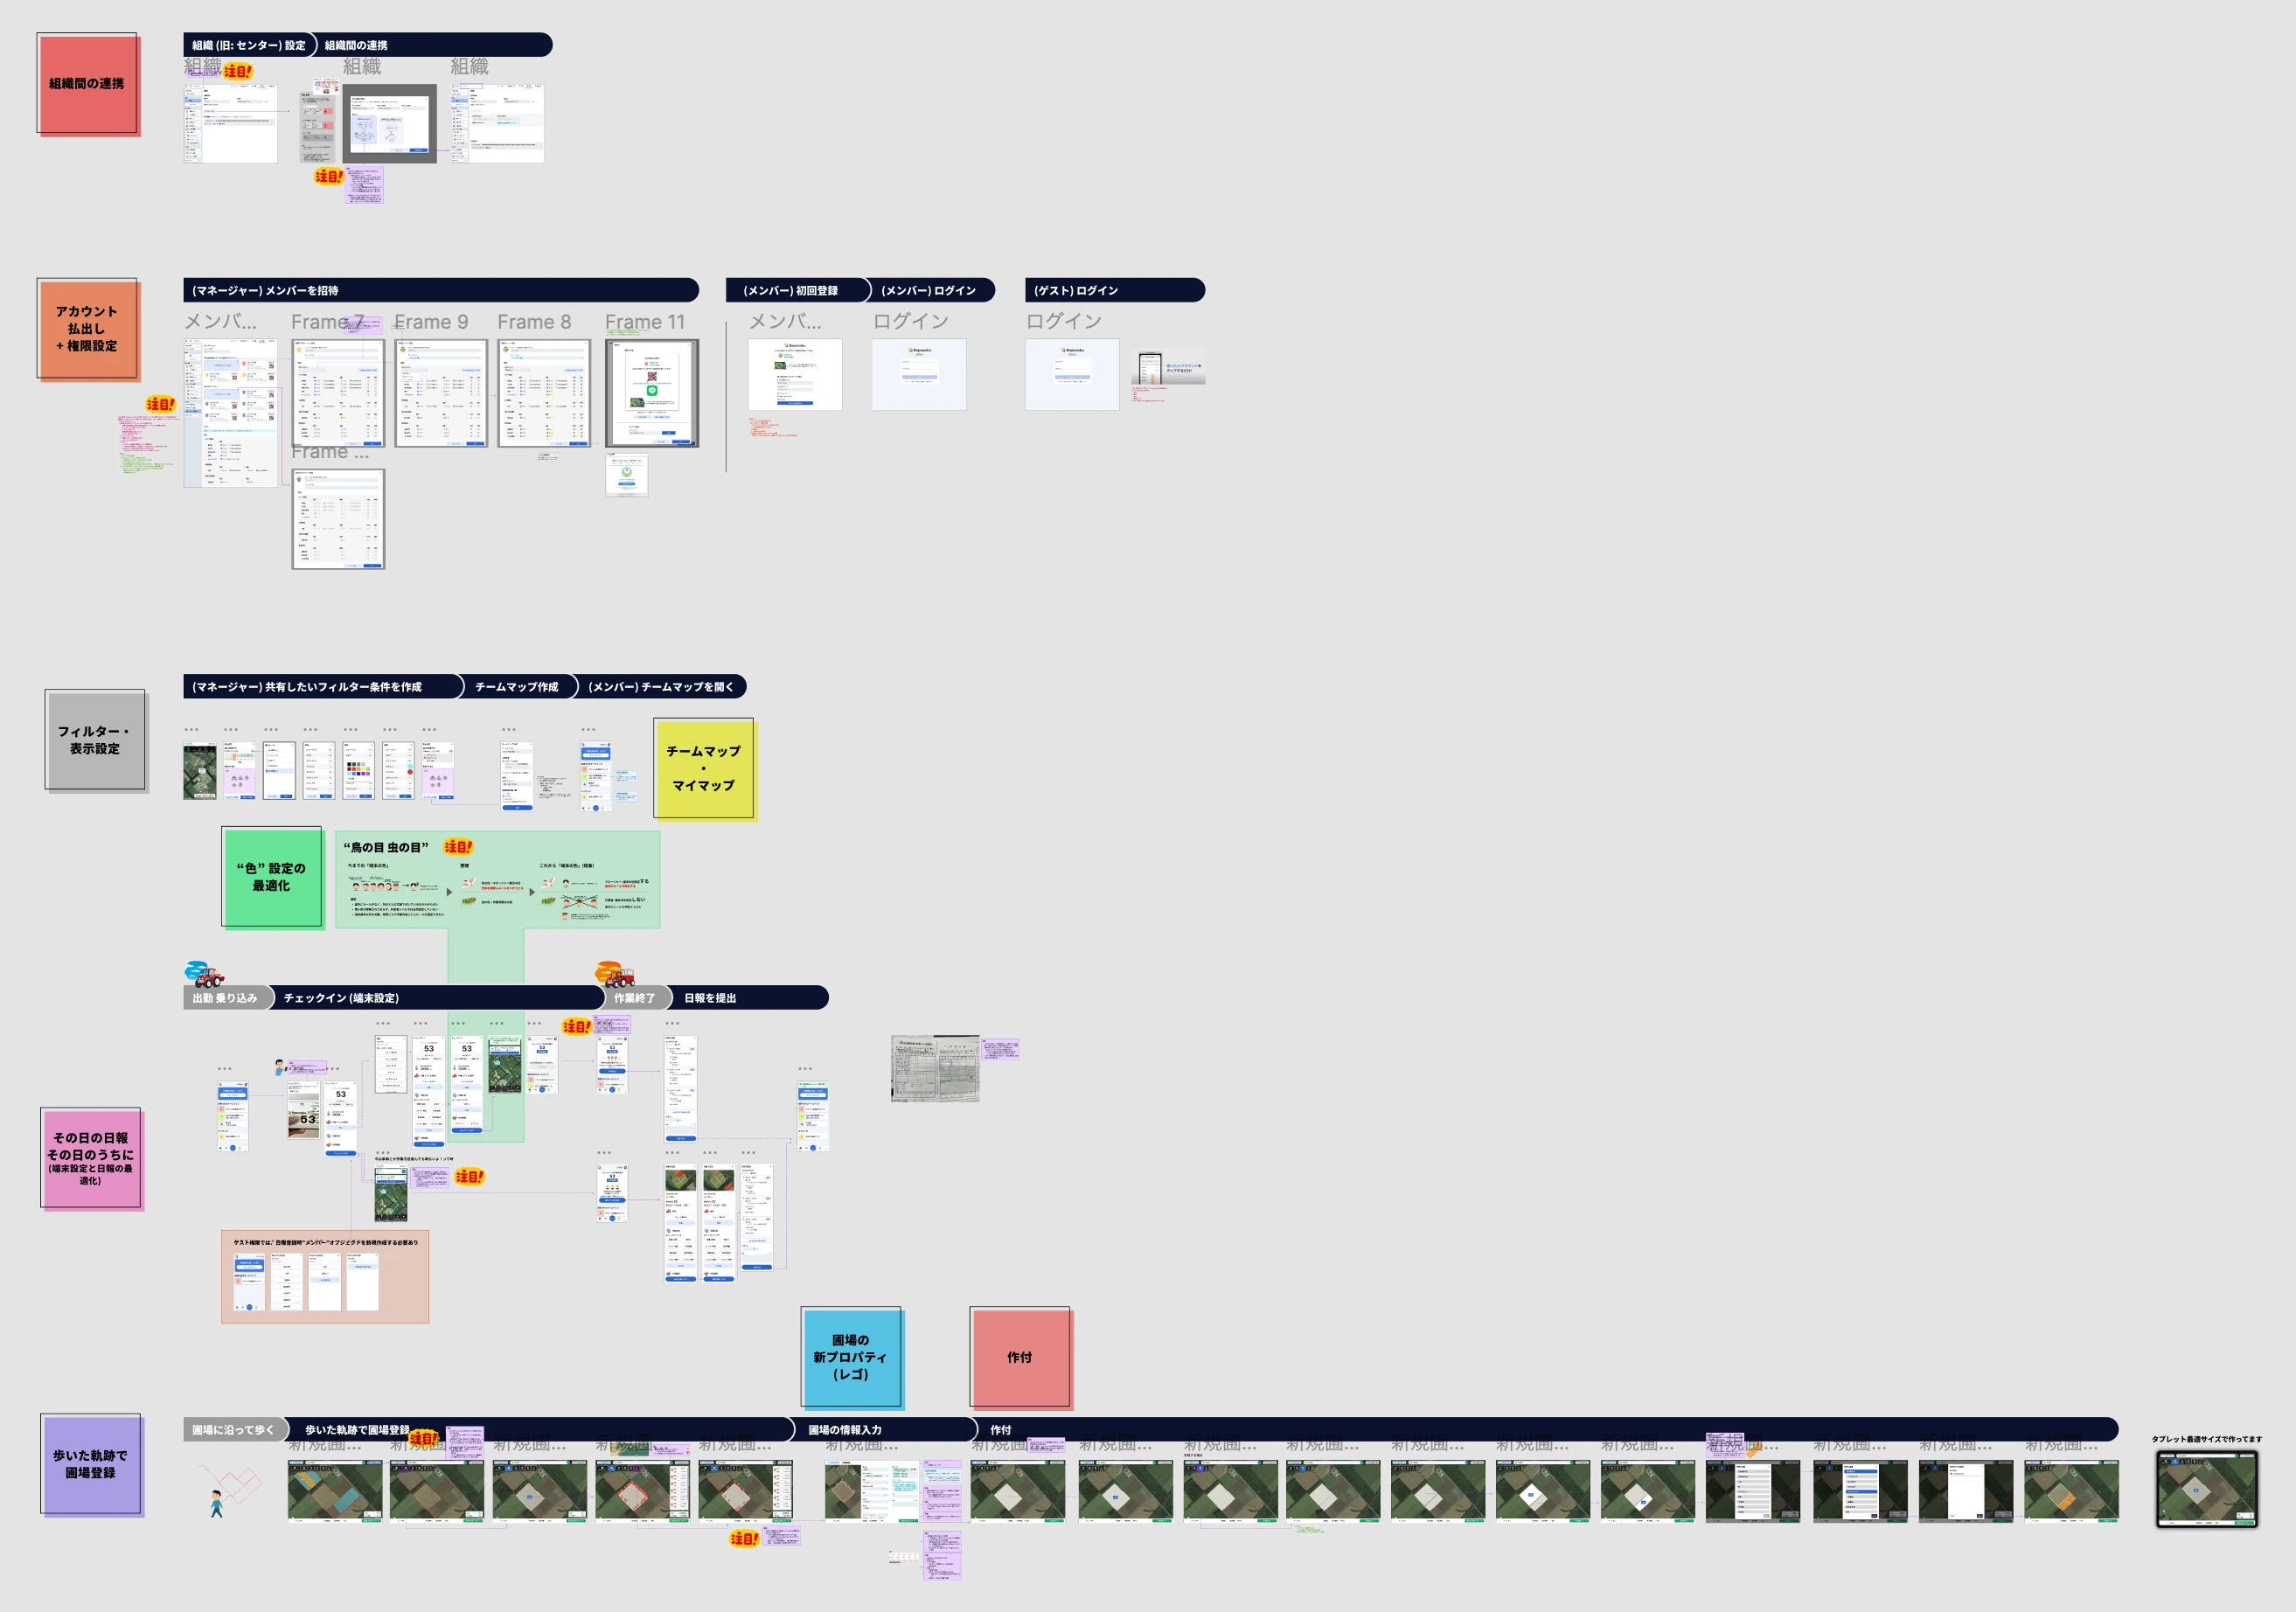
Context
Reposaku had a long-term vision to create an unmanned farm in Hokkaido, but no clear near-term development sequence for moving toward it.
The CEO, CTO, engineering, sales, and support teams each had different ideas, while nearly 300 customer requests had accumulated. Responding to individual requests based only on urgency or the loudest voice would scatter development resources and postpone the data foundation needed for future analysis and automation.
I led the roadmap process to compare customer requests and departmental ideas at the same level of detail and decide where the company should invest.
Decision 1 — Roadmap
Structure
Customer requests and departmental ideas ranged from “data infrastructure” to “a more convenient screen” and “support workload.” Their differing levels of detail made direct comparison impossible.
I grouped nearly 300 requests into 16 opportunity areas, then documented the target users, operational change, business impact, required data, and development and operational effort in a consistent format.
Evaluation
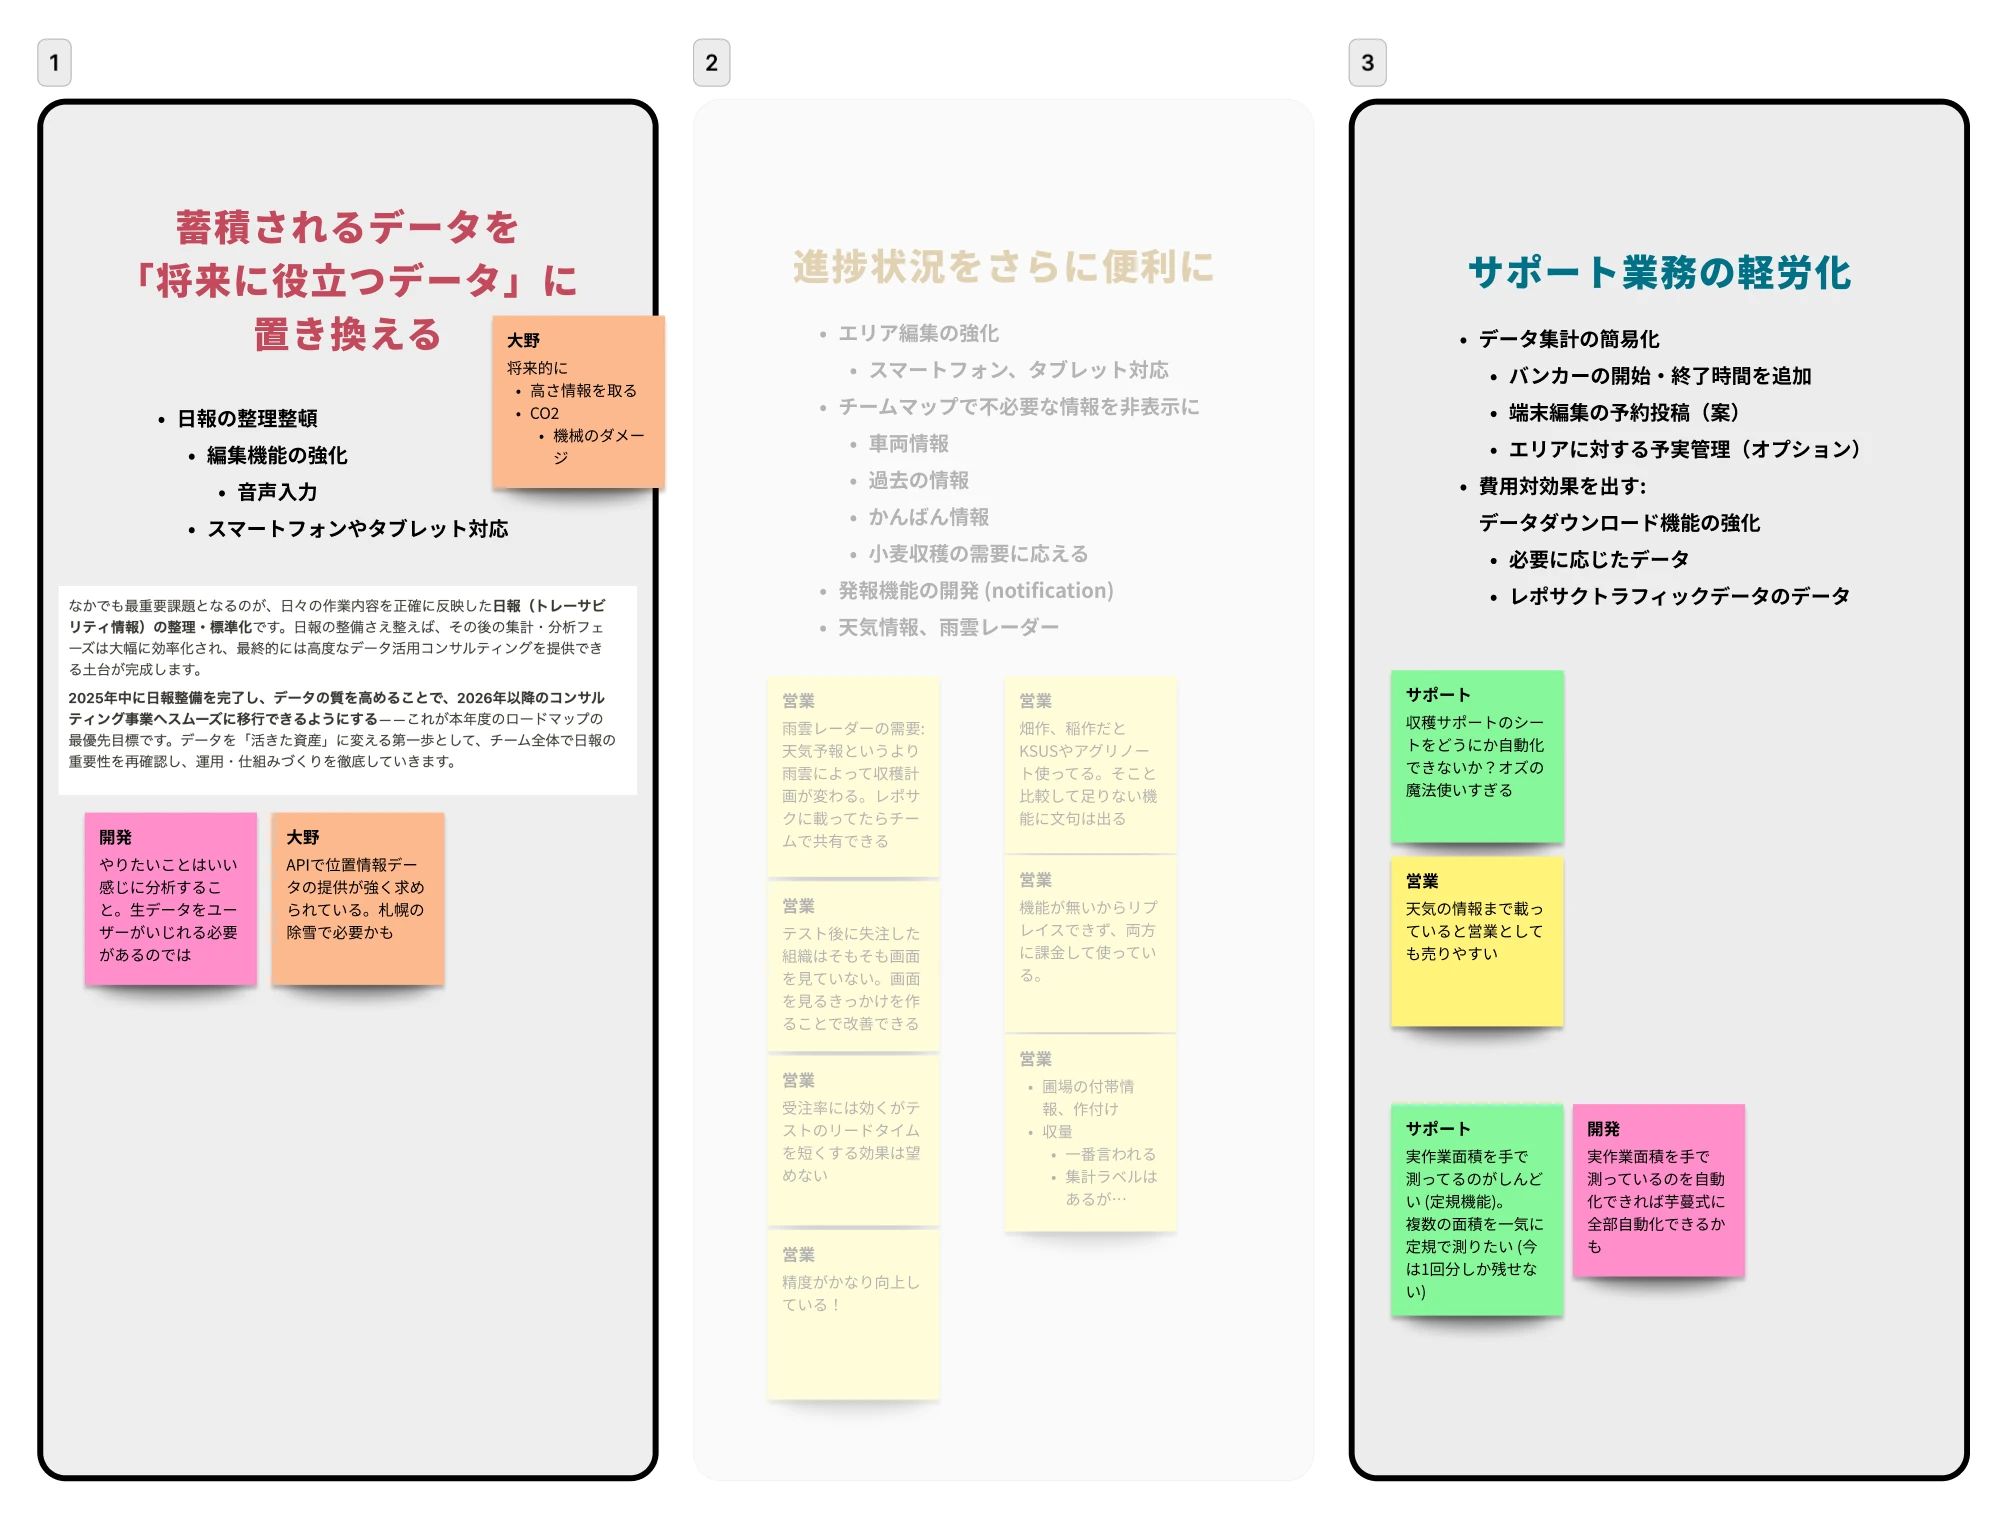
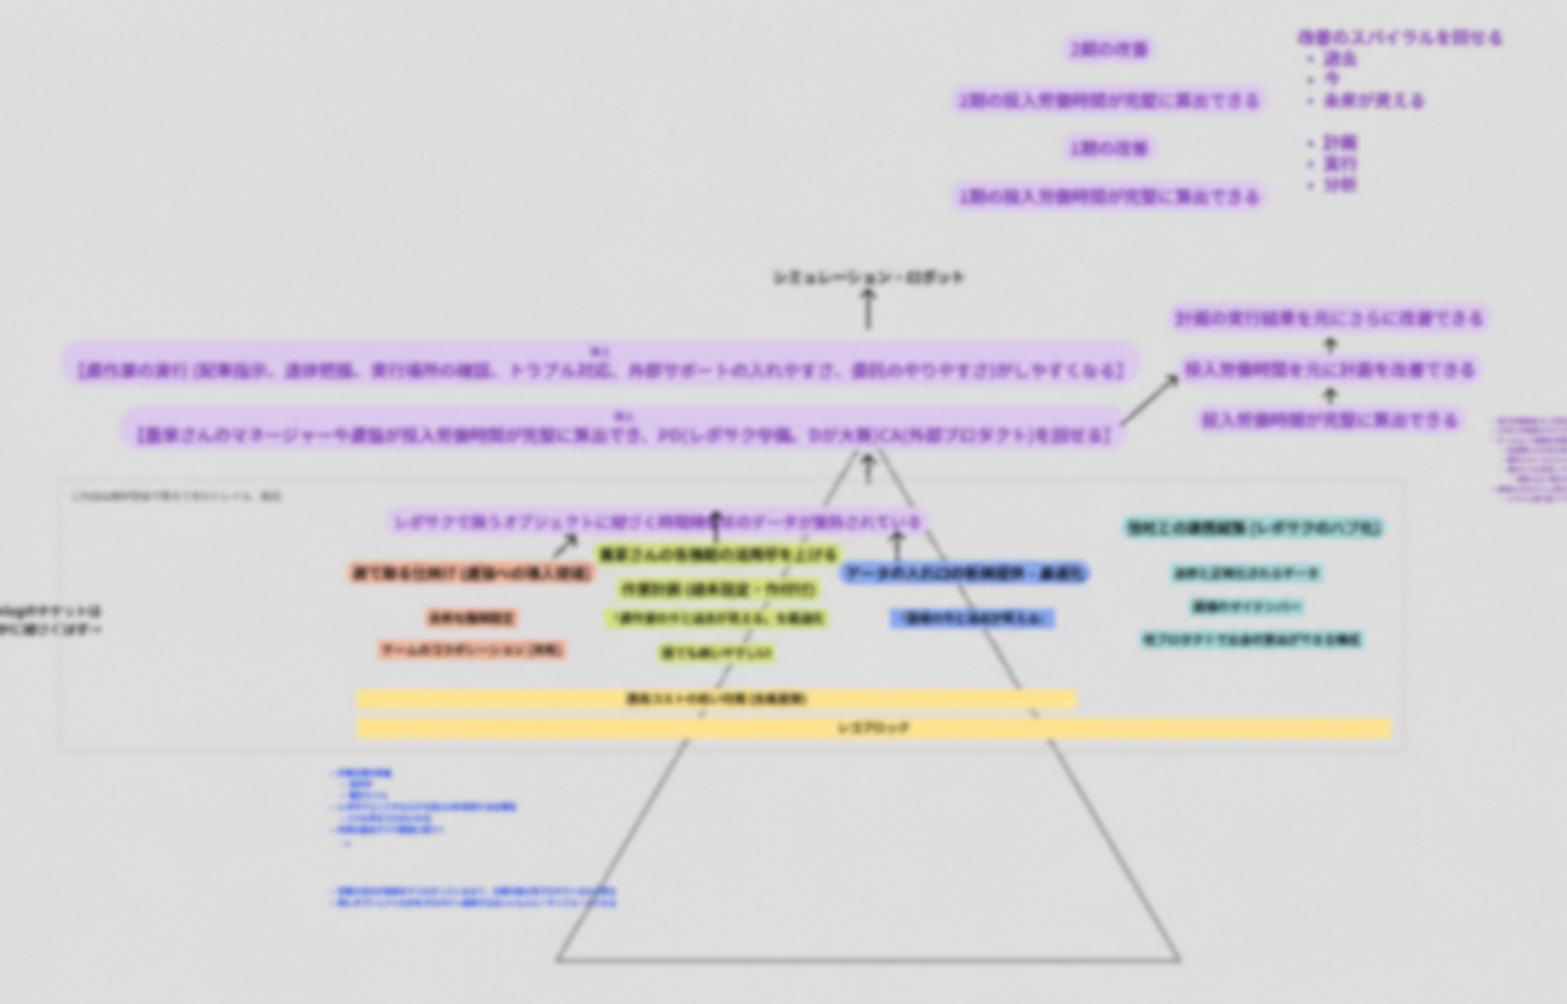
I placed the long-term vision—the business’s north star—at the top, followed by the jobs customers wanted to accomplish and the features that could enable them. Comparing ideas by the outcome they should create rather than by feature name made it possible to combine or remove proposals with similar goals.
Convergence
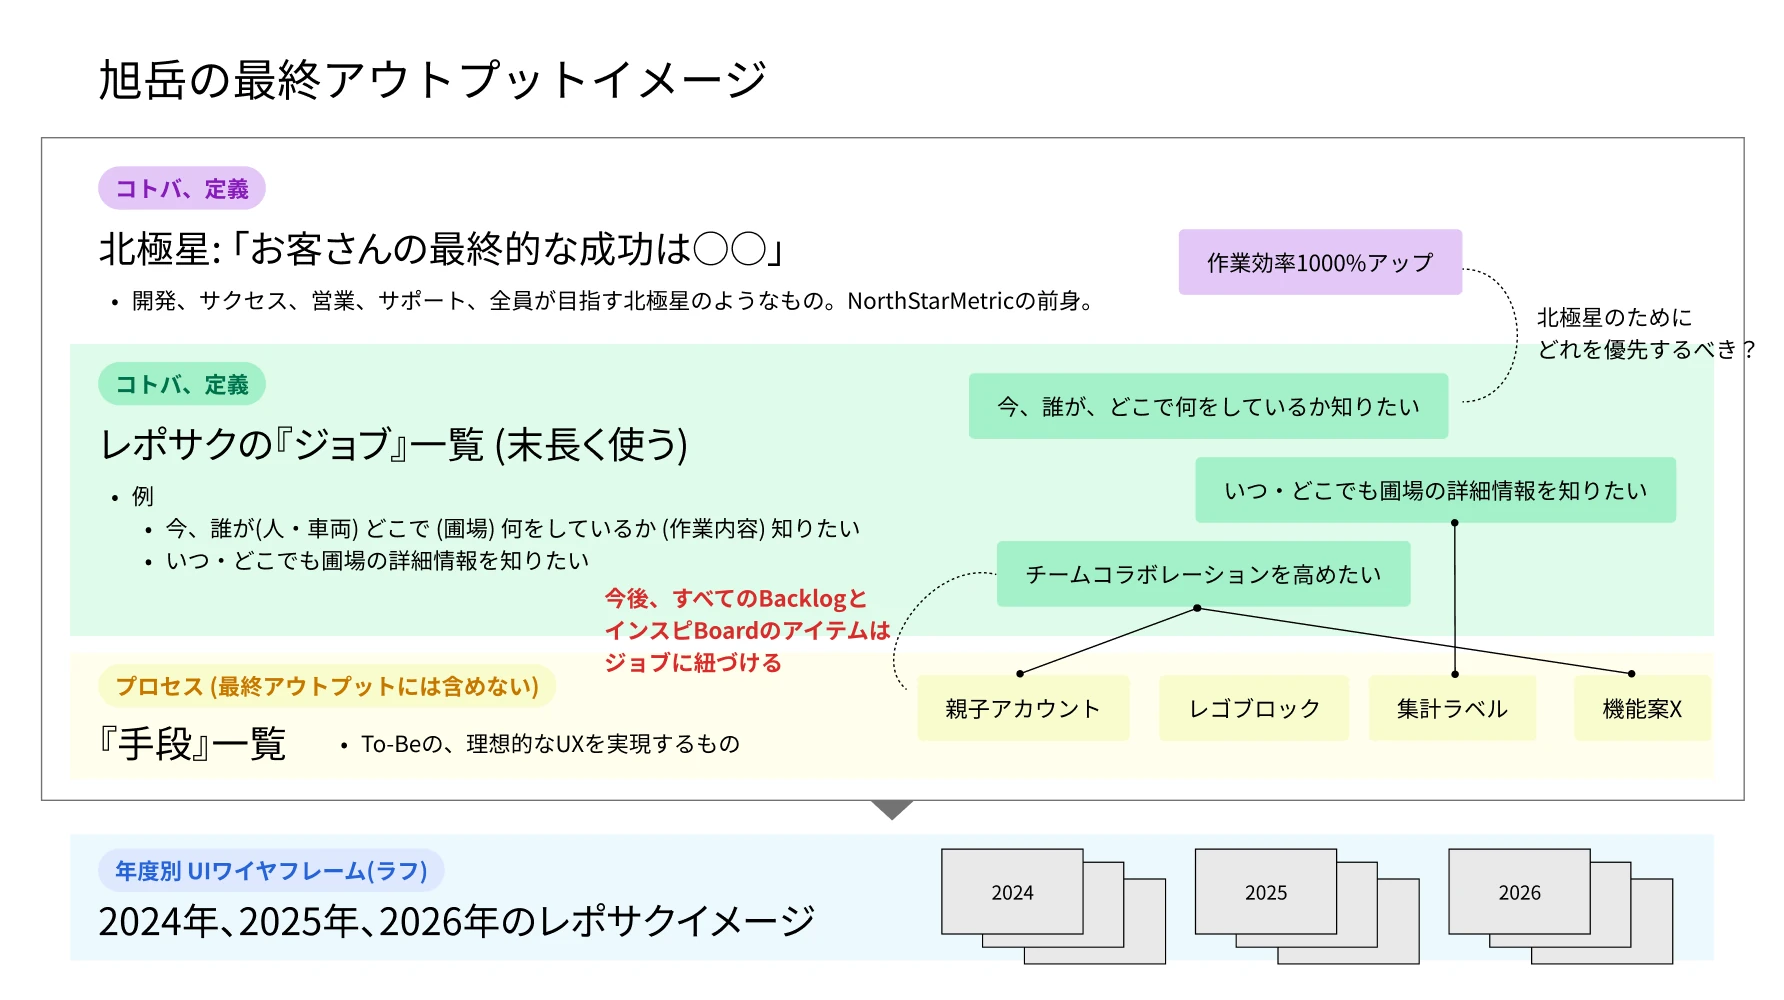
I made nine ideas tangible through lightweight prototypes so we could assess use cases, operational burden, and implementation effort. Reviews with the CEO and CTO, together with customer interviews, shaped seven development themes and their priorities into a roadmap.
The CEO and CTO made the final investment decisions, and the seven selected themes were incorporated into the overall roadmap.
Decision 2 — Daily Report
Redefinition
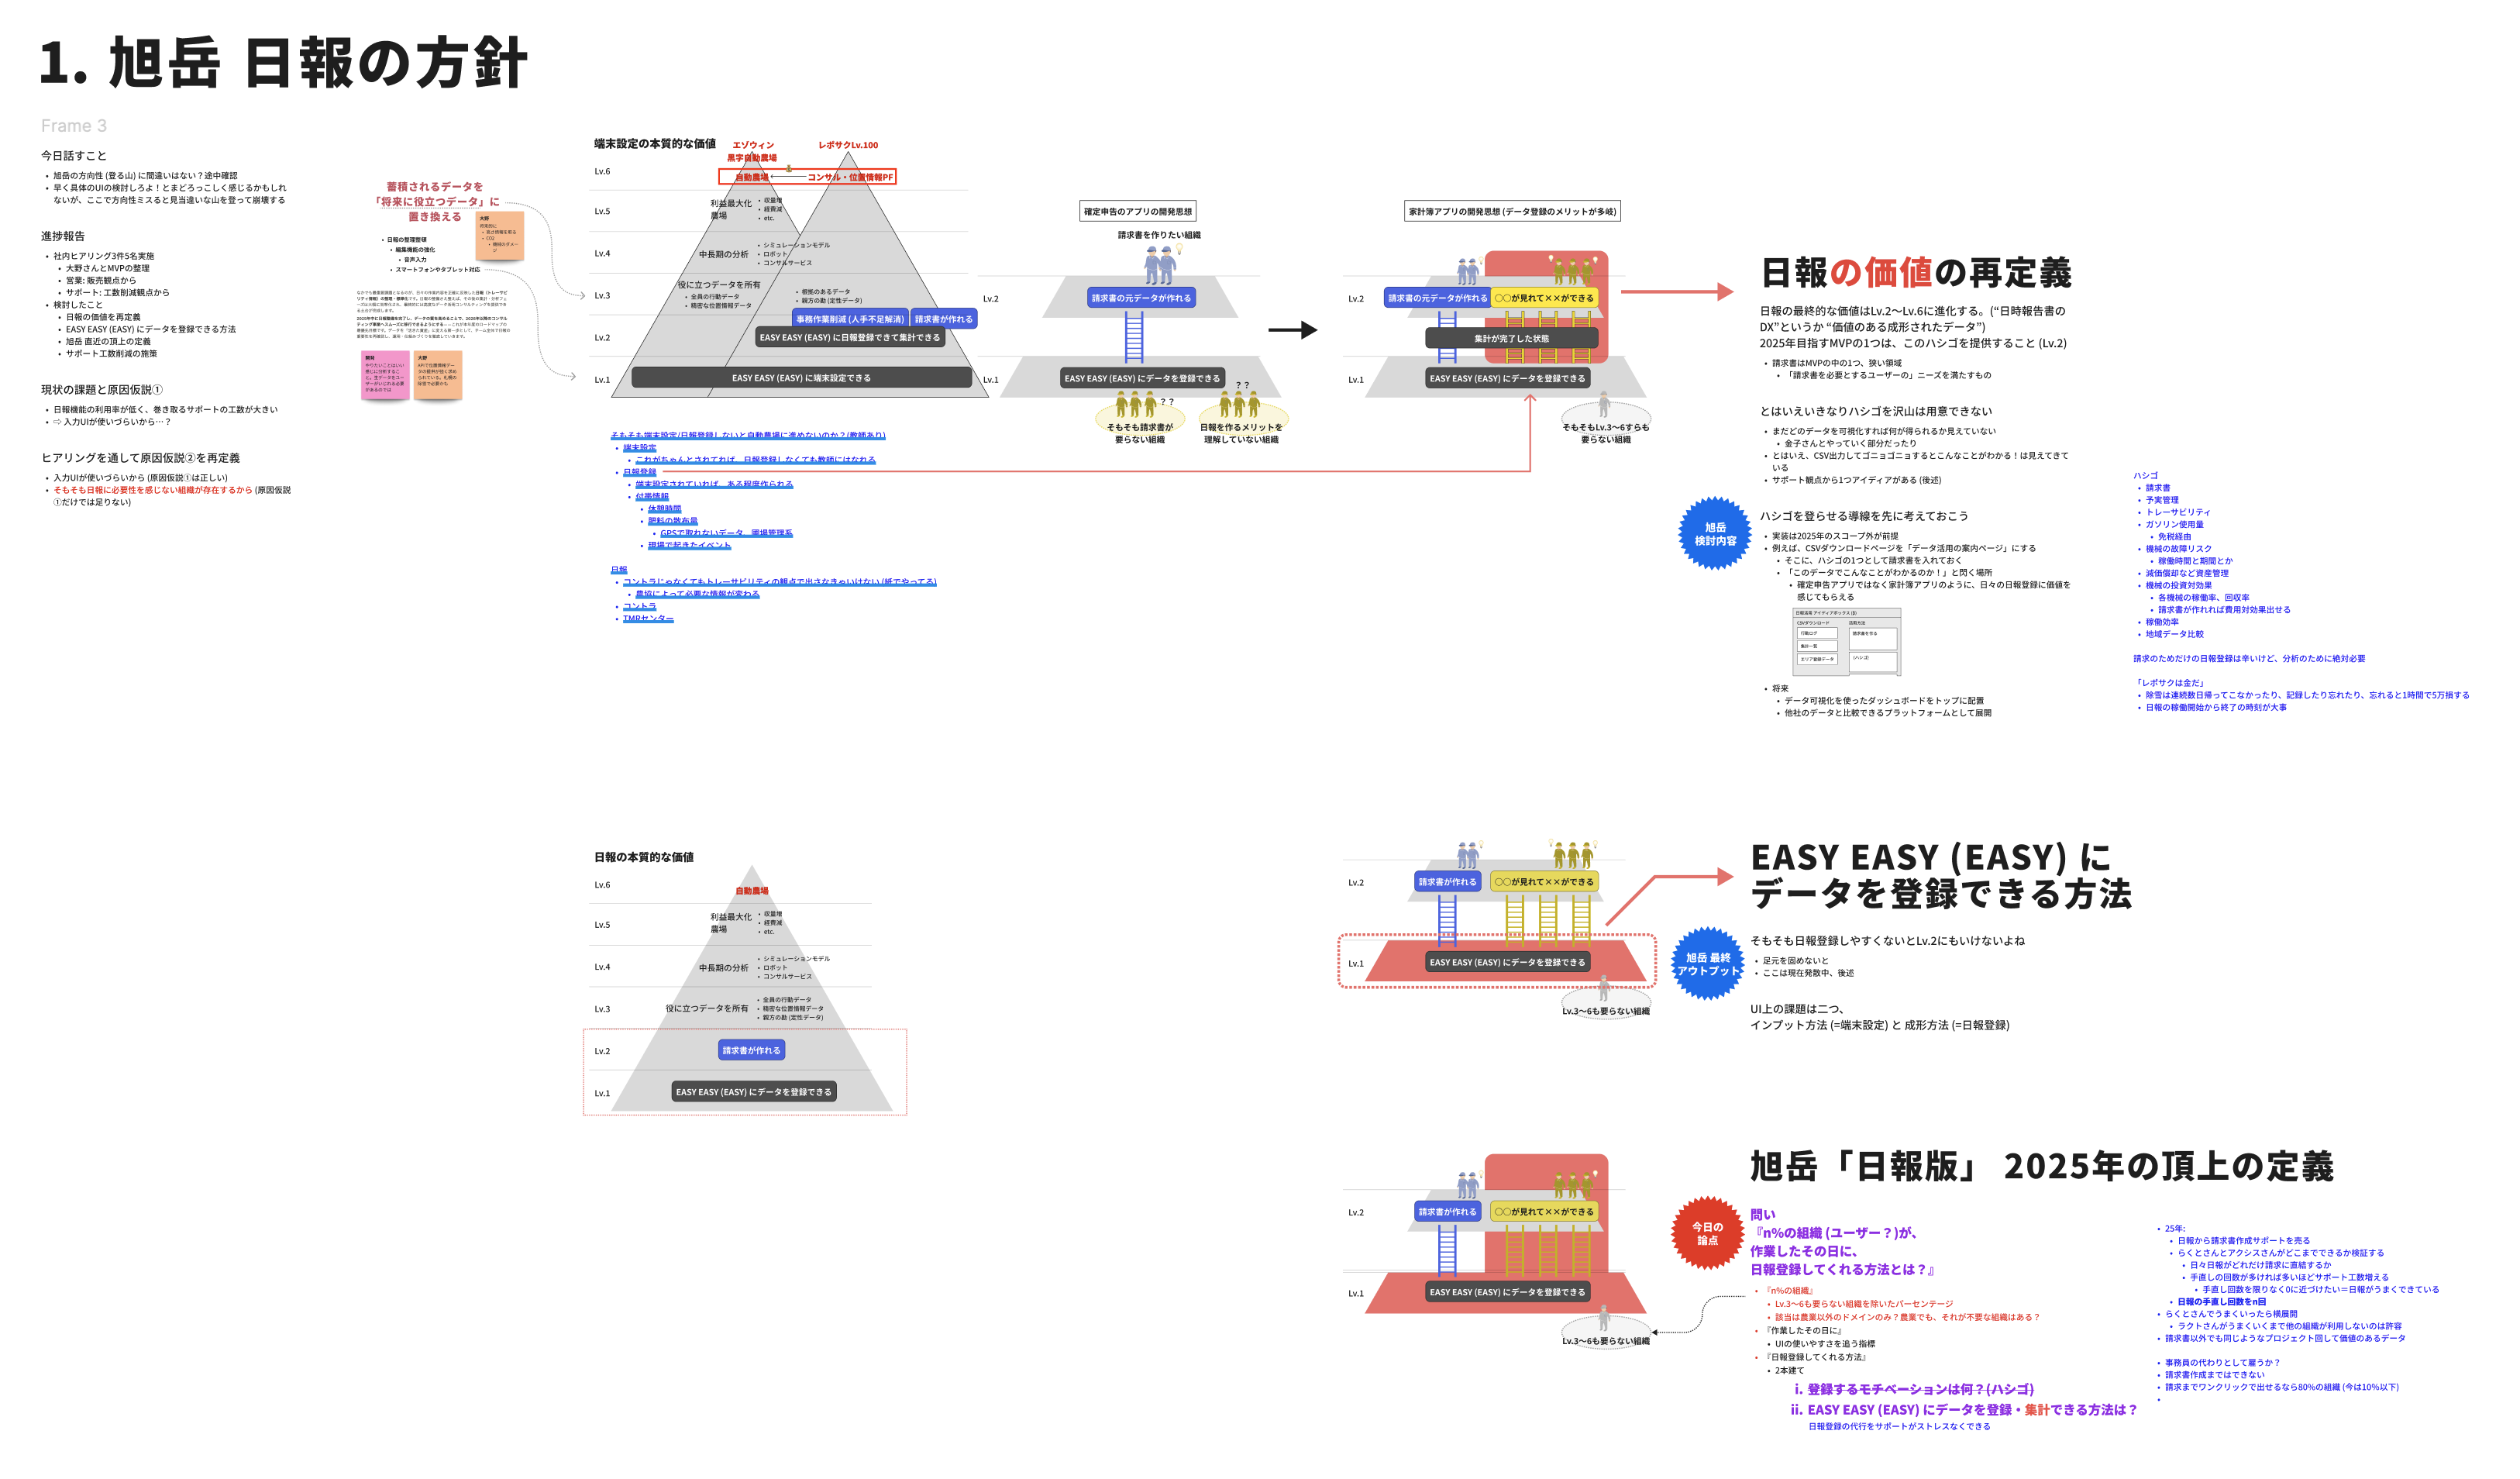
Among the seven themes, daily reporting became the highest priority as the foundation for generating the data required for future automation.
Analysis and automation require data that is both accurate and complete
01 Discovery
Context
I spent time in an agricultural company’s office and observed the real daily reporting workflow of sixteen farmers.
Daily reporting was not the farmers’ core work, and after a full day in the field there was little motivation to spend time creating an accurate record. Reports therefore varied in detail, contained inconsistencies, and were sometimes never submitted.
Insight
Digitizing paper alone would not produce accurate, complete data
Observed
Options
To make input as effortless as possible, I explored a wide range of approaches, including LINE-based and voice-input interfaces.
Product Roadmap
The earlier version of daily reporting had accumulated more than one hundred improvement requests from inside and outside the company.
I organized those requests and designed an experience that everyone in the field could realistically use while producing accurate, complete data.
Together with the CEO, CTO, and customer success team, I divided the requirements into phases and set priorities so the business could grow step by step.
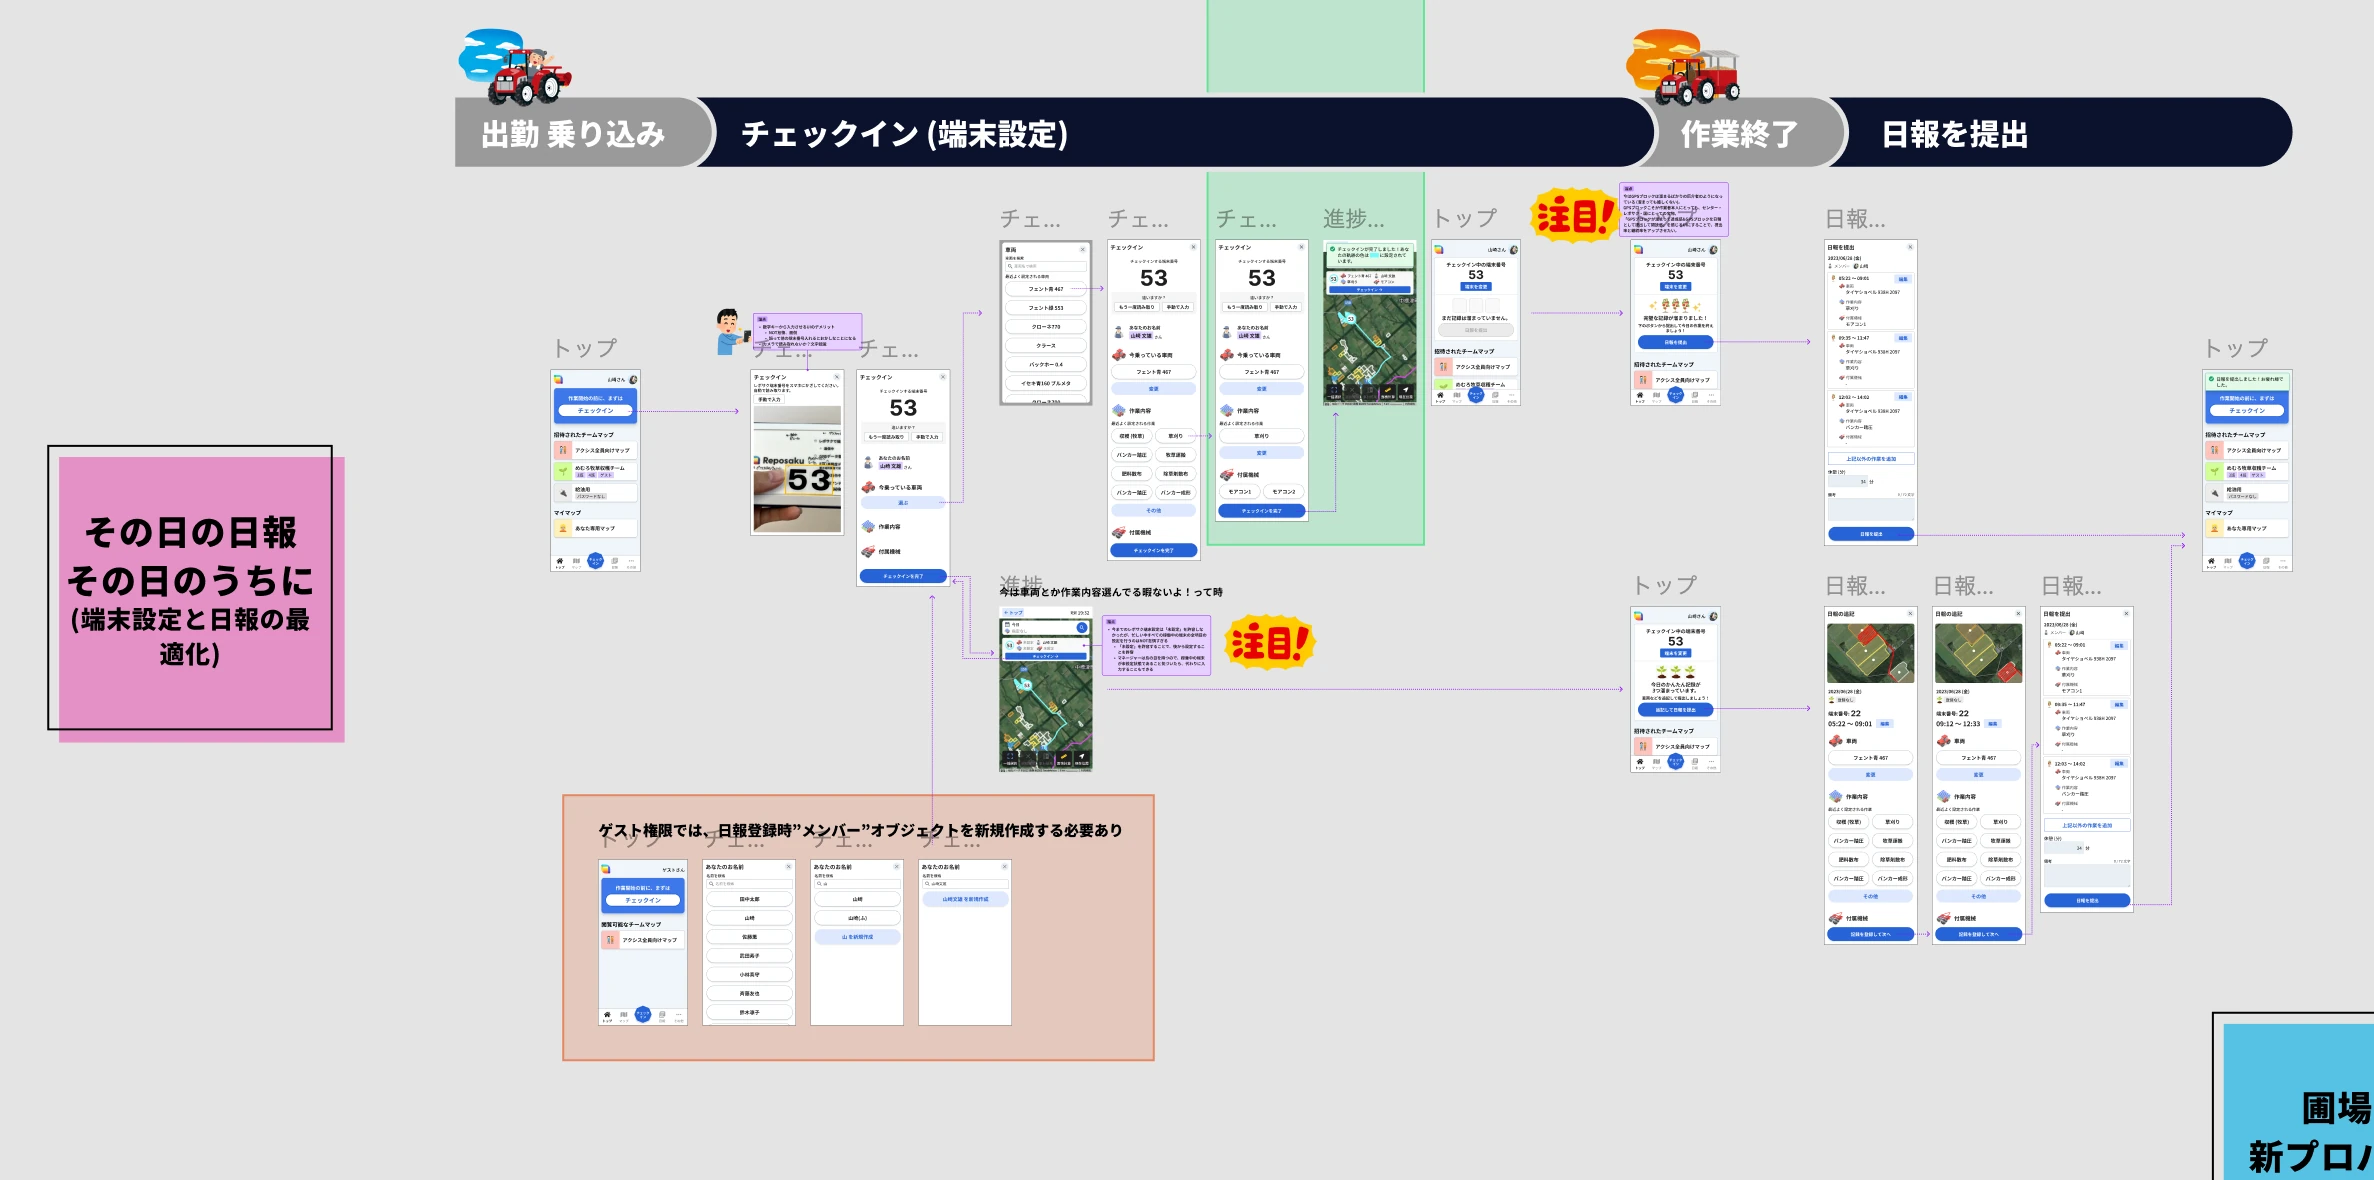
Create and submit a daily report on a phone using GPS data.
Add submission status, proxy submission, corrections, help, and the details required for daily operations.
Raise data quality to support aggregation, CSV exports, billing, analysis, and new industries.
02 Concept
Reposaku captures GPS data showing who used which vehicle, where they went, and what work they performed—the information required for a daily report. I designed a simple experience in which the system generates a draft from that data and farmers only need to review and approve it.
03 Product Structure
I treated exceptions as signals for a shared structure that could support different operations, not as one-off features to add.
Users can inspect location, speed, and time, then split one GPS log into multiple tasks.
Logs are not fixed to one person; workers select their own activity from company-wide data.
Office and maintenance work can be submitted manually through the same flow used on GPS-recorded days.
IMPACT
The CEO and CTO made the final investment decisions. I turned nearly 300 requests into comparable options, defined the overall roadmap, and set the MVP for daily reporting as a priority theme.
Decision 1 — Roadmap
We selected seven development themes from sixteen opportunity areas and aligned on their execution sequence. The top two themes were released within four months of completing the roadmap.This shifted the conversation from responding to requests toward making company-wide investment decisions.
Decision 2 — Daily Report MVP
GPSログから自動生成することで、記憶や時間の丸めに依存していた日報を、記録された事実を確認・修正する業務へ変えた。
「車両を使う現場が、位置と時間から作業記録を作る」という共通構造として設計したため、ごみ収集や除雪など、車両を使う他業種への展開を可能にした。